 Diligence for Excel
Online User Manual
Formula Map Function
For Diligence v2.4x, March 2016
This online manual is best navigated by clicking the relevant contents item just below, or Finding the topic of interest by pressing Ctrl-F and entering the required text at the bottom of the screen.
The Full Diligence for Excel Manual is available in PDF format HERE
Contents
Map a Single Worksheet or All Populated Worksheets
Using a Formula Map as Test Evidence
Limitations, Questions & Tips.
Formula Map
The Formula Map helps users understand the structure of an Excel file by colour-coding different formulas in their own colour. It is useful for exposing material errors and structural anomalies in complex spreadsheets.
Creating A Formula Map
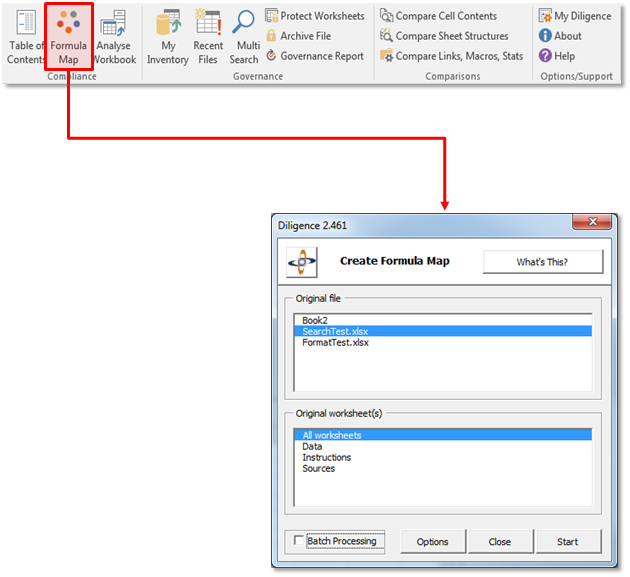
A Formula Map can be created from any Excel worksheet or workbook by pressing ‘Formula Map’ on the Diligence ribbon, and then pressing ‘Start’ from the resultant userform.
![]() The
original file is left untouched.
The
original file is left untouched.
Map a Single Worksheet or All Populated Worksheets
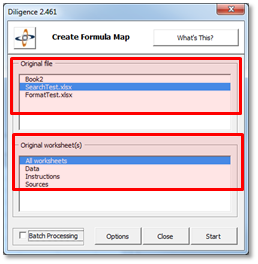
A Formula Map can be created either for a single worksheet, or an entire workbook.
 After
selecting the required workbook in the top section of the userform, select
whether to map a single worksheet or the entire workbook.
After
selecting the required workbook in the top section of the userform, select
whether to map a single worksheet or the entire workbook.
The default setting is ‘All worksheets’, but any single worksheets can be selected directly from the userform. This may be useful, for example, when the workbook contains one or more extremely large worksheets that have already been analysed.
Please note that workbooks or worksheets containing no data will not be shown in the lists, and will be excluded from any Map workbook.
Simple Formula Map Example
 Below
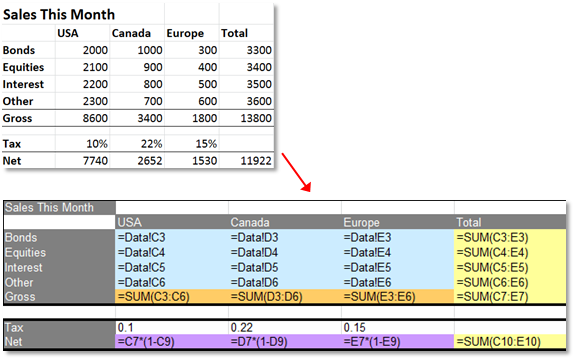
is an example of a simple test worksheet and its resultant Formula Map …
Below
is an example of a simple test worksheet and its resultant Formula Map …
The main features of the map are that …
· Original formatting & row/column sizing has been removed.
· The map displays formulas instead of formula results
· Formulas with the same ‘relative’ cell‑references are shown in the same colour.
Understanding the Formula Map
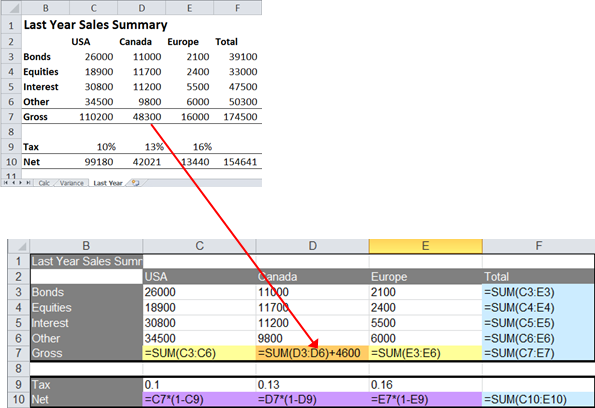
The formula map’s power is in the graphical representation of unexpected changes in formula structure.
By reviewing the different colour patterns, any user can ascertain the consistency of these formula patterns.
A well designed worksheet is likely to have good consistency in its formula patterns, and although it is reasonable to state that pattern inconsistency is often an indicator of poor worksheet design, the patterns do NOT dictate or even suggest the correctness of the formulas used.
It can be argued that irregular formula patterns are more prone to error and these errors are far more likely to propagate over time due to the inconsistencies in the worksheet’s design.
Pattern Inconsistencies Usually Indicate Poor Design OR Potential Errors
 Below
is a similar test sheet and map. Observe how the orange SUM() formula at Cell
D7 shows its inconsistency to the others
Below
is a similar test sheet and map. Observe how the orange SUM() formula at Cell
D7 shows its inconsistency to the others
Formula Map Key
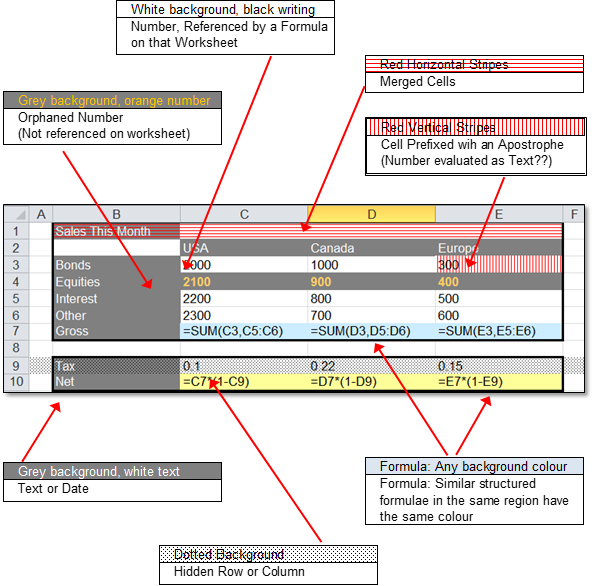 The
formula map uses colours and shading to highlight seven different features of
the original source file …
The
formula map uses colours and shading to highlight seven different features of
the original source file …
For convenience, the key is also displayed on the summary sheet, presented with each Formula Map.
Using a Formula Map as Test Evidence
One of the key uses of a Formula Map is to use as part evidence that the workbook is fit for purpose, especially after a change has been made.
By default, Diligence maps each worksheet in the workbook. In addition, it also creates a summary page that can gives extra summary details, and be used to comment on observations or additional evidence. The summary is on the first sheet, and the maps on subsequent worksheets.
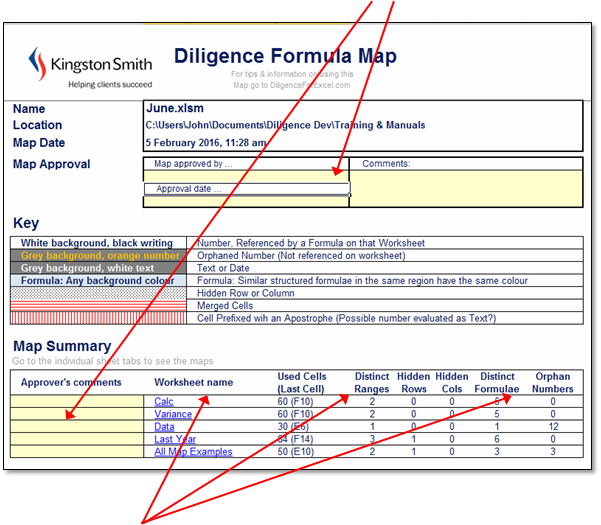
 Below, is an example of the summary, with dedicated lemon coloured
cells for comments…
Below, is an example of the summary, with dedicated lemon coloured
cells for comments…
Additional Details
· Worksheet Name; Entered as a Hyperlink to jump straight to that sheet’s map.
· Number of Used Cells (Rows x Columns to the Last Cell) & Last Cell address.
· Distinct Ranges; The number of different contiguous ranges on the sheet.
· Number of Hidden Rows / Hidden Cols.
· Distinct Formula; The number of different formulas whole ‘relative’ contents differ.
· Orphan Numbers: Quantity of numeric values not referenced on the sheet.
Formula Map Options
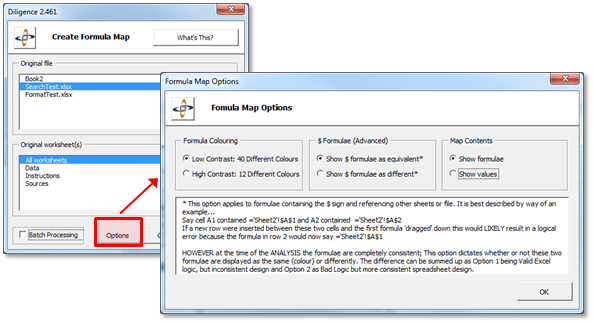 Three
options are available, which are accessed from the main Formula Map userform …
Three
options are available, which are accessed from the main Formula Map userform …
Formula Colouring:
The default selection of 40 low contrast, pastel colours can be replaced with 12 high contrast values. Please note that the 12 colour option significantly increases the probability that two adjacent formulas containing different formulas have been allocated the same colour.
$ Option
This is a subtle option that is described in detail on the userform …
This option applies to formulae containing the $ sign and referencing other sheets or file. It is best described by way of an example …
Say cell A1 contained ='Sheet2'!$A$1 and A2 contained ='Sheet2'!$A$2
If a new row were inserted between these two cells and the first formula 'dragged' down this would LIKELY result in a logical error because the formula in row 2 would now say ='Sheet2'!$A$1
HOWEVER at the time of the ANALYSIS the formulae are completely consistent; This option dictates whether or not these two formulae are displayed as the same (colour) or differently. The difference can be summed up as Option 1 being Valid Excel logic, but inconsistent design and Option 2 as Bad Logic but more consistent spreadsheet design.
Formulas or Values
On occasion, it may be preferable to display the cell values, as normally displayed on the standard workbook, rather than the default formulas. Note that the cell formulas still define the colour of the cells.
Formula Map Batch Processing
This advanced feature allows a user to create Formula Maps for multiple files unattended.
WARNING
Diligence Batch‑Processing leverages the requirements on the user’s PC considerably. Users are advised to build up from two or three small files, to ascertain how their particular machines performs in this situation. The batch function is NOT supported by Diligence; by which we mean users encountering errors will simply be requested to create Formula Maps one at a time.
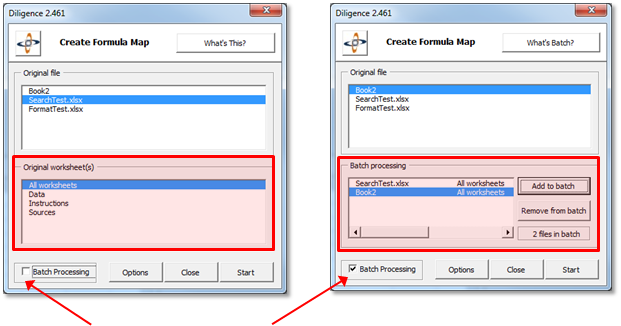 Batch Processing can
be toggled On/Off via the standard Formula Map Userform
Batch Processing can
be toggled On/Off via the standard Formula Map Userform
(Toggling the Batch Processing Check-Box)
Toggling results in the lower half of the userform switching between worksheet choice and the list of files selected for batch processing.
In Batch Processing Mode all the worksheets in each chosen file are processed
When in Batch Processing mode select the relevant files one at a time from the top part of the userform then press the ‘Add to Batch’ button. Press the ‘Start’ button when all required files are listed. One report file will be created for each file selected.
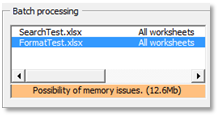
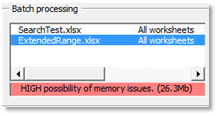 An
Amber warning is displayed if there are four or more files selected, or the
combined selected file size exceeds 10Mb. A Red warning is displayed if there
are seven or more files selected, or the combined selected file size exceeds
20Mb
An
Amber warning is displayed if there are four or more files selected, or the
combined selected file size exceeds 10Mb. A Red warning is displayed if there
are seven or more files selected, or the combined selected file size exceeds
20Mb
The warnings are for information only, and do not prevent execution of the function.
Limitations, Questions & Tips
Limitations
Formula Maps are limited to 99 worksheets. If analysis is required on a workbook containing over 99 sheets, the file will need to be spilt into multiple workbooks.
Most Asked Questions…
Will the Formula Map find all the structural errors in my workbook?
Not necessarily. The Formula Map is just one of the tools that aids analysis of a file and there is no definitive method by which all errors can be found automatically. It is however, one of the simplest and most productive analysis and error checking tools available and would be expected to be a significant aspect of any user‑driven compliance and governance policy.
How long does the Formula Map take to run?
The time taken is a direct function of the number and size of the individual worksheets, and an exponential function of the complexity of each worksheet, plus a dependency on the PC used. Relatively small and simple file usually complete in under a minute. Large and complex worksheets can easily take an hour or more.
Professional Tips
· For large or complicated workbooks, or when using the Batch Processing feature, a good speed improvement can be achieved by leaving the computer otherwise unused. I.E try and not use other programs.
· Use Excel to zoom out to see hundreds or even thousands of cells at a time, then zoom in on areas of interest.